Graphviz 介绍
介绍一个高效而简洁的绘图工具 graphviz。graphviz 是贝尔实验室开发的一个开源的工具包,它使用一个特定的 DSL(领域特定语言):dot 作为脚本语言,然后使用布局引擎来解析此脚本,并完成自动布局。graphviz 提供丰富的导出格式,如常用的图片格式,SVG,PDF 格式等。
graphviz 中包含了众多的布局器:
- dot 默认布局方式,主要用于有向图
- neato 基于 spring-model(又称 force-based) 算法
- twopi 径向布局
- circo 圆环布局
- fdp 用于无向图
本文主要介绍 dot 有向图。
首先,在 dot 脚本中定义图的顶点和边,顶点和边都具有各自的属性,比如形状,颜色,填充模式,字体,样式等。然后使用合适的布局算法进行布局。布 局算法除了绘制各个顶点和边之外,需要尽可能的将顶点均匀的分布在画布上,并且尽可能的减少边的交叉(如果交叉过多,就很难看清楚顶点之间的关系了)。所 以使用 graphviz 的一般流程为:
- 定义一个图,并向图中添加需要的顶点和边
- 为顶点和边添加样式
- 使用布局引擎进行绘制
在我的机器上,使用 Sublime Text 编辑 dot 脚本,然后将 F7/Cmd-B 映射为调用 dot 引擎去绘制当前脚本,并打开一个新的窗口来显示运行结果:
Sublime Text 3 集成 Graphviz 方法
如下:
第一步:下载 https://github.com/munro/SublimeGraphvizPreview/archive/master.zip
第二步:打开 Preferences -> Packages Settings-> Packages Control -> Settings User,来确认一下 installed_packages 没有 GraphVizPreview。并且增加”remove_orphaned”: false 防止 Sublime Text 把手动安装的插件包给删除了。
{
  "bootstrapped": true,
  "in_process_packages":
  [
  ],
  "installed_packages":
  [
  "EncodingHelper",
  "Package Control",
  "Theme - Spacegray"
  ],
  "remove_orphaned": false
}
第三步:打开 Preferences -> Browse Packages…进入到 Sublime Text 的插件包下 Packagas。
第四步:解压 zip 文件到 Packagas 下,并且更改文件夹 SublimeGraphvizPreview-master 为 GraphVizPreview。
第五步:重启 Sublime Text。
注:快捷键为
Win+Shift+G,调用 Graphviz 调用 dot 引擎去绘制当前脚本。
使用 graphviz 绘制流程图
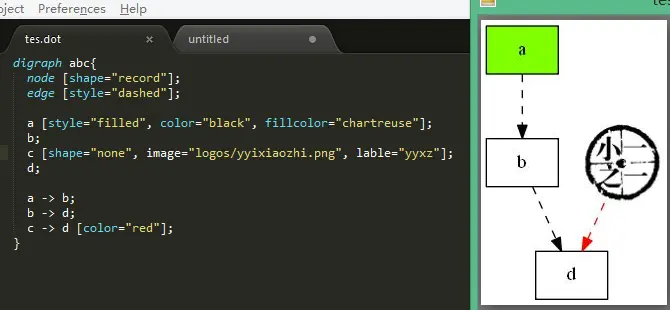
注:引用 image 图片的时候,需要使用命令,
使用 dot 命令编译,如
dot hello.dot -T png -o hello.png
完整的命令为:
<cmd> <inputfile> -T <format> -o <outputfile>
示例如下:
D:\\>dot -Tjpg tes.dot -o test.jpg
<cmd> |
介绍 |
|---|---|
| dot | 渲染的图具有明确方向性。 |
| neato | 渲染的图缺乏方向性。 |
| twopi | 渲染的图采用放射性布局。 |
| circo | 渲染的图采用环型布局。 |
| fdp | 渲染的图缺乏方向性。 |
| sfdp | 渲染大型的图,图片缺乏方向性。 |
基础知识
graphviz 包含 3 中元素,图,顶点和边。每个元素都可以具有各自的属性,用来定义字体,样式,颜色,形状等。
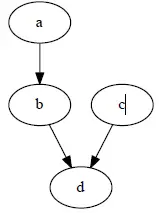
第一个 graphviz 图
digraph abc{
  a;
  b;
  c;
  d;

  a -> b;
  b -> d;
  c -> d;
}
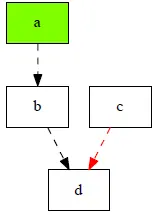
进一步修改顶点和边样式
将顶点 a 的颜色改为淡绿色,并将 c 到 d 的边改为红色。
digraph abc{
  node [shape="record"];
  edge [style="dashed"];

  a [style="filled", color="black", fillcolor="chartreuse"];
  b;
  c;
  d;

  a -> b;
  b -> d;
  c -> d [color="red"];
}
子图的绘制
digraph abc{

  node [shape="record"];
  edge [style="dashed"];

  a [style="filled", color="black", fillcolor="chartreuse"];
  b;

    subgraph cluster_cd{
      label="c and d";
      bgcolor="blue";
      c;
      d;
    }

  a -> b;
  b -> d;
  c -> d [color="red"];
}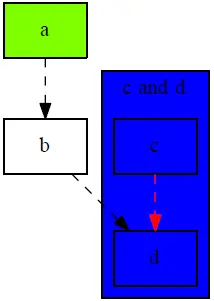
注:子图的名称必须以 cluster 开头,否则 graphviz 无法设别。
数据结构的可视化
一个 hash 表的数据结构
hash 表内容
struct st_hash_type {
    int (*compare) ();
    int (*hash) ();
};

struct st_table_entry {
    unsigned int hash;
    char *key;
    char *record;
    st_table_entry *next;
};

struct st_table {
    struct st_hash_type *type;
    int num_bins;
/* slot count */
    int num_entries;
/* total number of entries */
    struct st_table_entry **bins;
/* slot */
};
脚本如下:
digraph st2{
  fontname = "Verdana";
  fontsize = 10;
  rankdir=TB;

  node [fontname = "Verdana", fontsize = 10, color="skyblue", shape="record"];

  edge [fontname = "Verdana", fontsize = 10, color="crimson", style="solid"];

  st_hash_type [label="{<head>st_hash_type|(*compare)|(*hash)}"];
  st_table_entry [label="{<head>st_table_entry|hash|key|record|<next>next}"];
  st_table [label="{st_table|<type>type|num_bins|num_entries|<bins>bins}"];

  st_table:bins -> st_table_entry:head;
  st_table:type -> st_hash_type:head;
  st_table_entry:next -> st_table_entry:head [style="dashed", color="forestgreen"];
}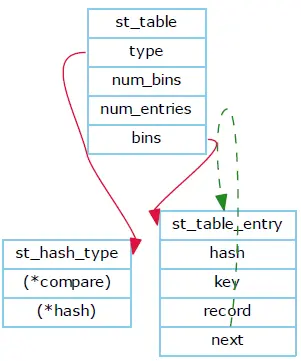
注:在顶点的形状为 record 的时候,label 属性的语法比较奇怪,但是使用起来非常灵活。比如,用竖线”|”隔开的串会在绘制出来的节点中展 现为一条分隔符。用<>括起来的串称为锚点,当一个节点具有多个锚点的时候,这个特性会非常有用,比如节点 st_table 的 type 属性指 向 st_hash_type,第 4 个属性指向 st_table_entry 等,都是通过锚点来实现的。
使用默认的 dot 布局后,绿色的这条边覆盖了数据结构 st_table_entry,并不美观,因此可以使用别的布局方式来重新布局,如使用 circo 算法可以得到更加合理的布局结果。
D:\\>circo -Tjpg tes.dot -o test.jpg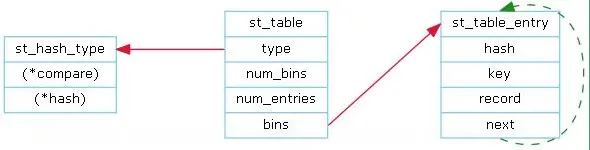
hash 表的实例
digraph st{
  fontname = "Verdana";
  fontsize = 10;
  rankdir = LR;
  rotate = 90;

  node [ shape="record", width=.1, height=.1];
  node [fontname = "Verdana", fontsize = 10, color="skyblue", shape="record"];

  edge [fontname = "Verdana", fontsize = 10, color="crimson", style="solid"];
  node [shape="plaintext"];

  st_table [label=<
      <table border="0" cellborder="1" cellspacing="0" align="left">
      <tr>
      <td>st_table</td>
      </tr>
      <tr>
      <td>num_bins=5</td>
      </tr>
      <tr>
      <td>num_entries=3</td>
      </tr>
      <tr>
      <td port="bins">bins</td>
      </tr>
      </table>
  >];

  node [shape="record"];
  num_bins [label=" <b1> | <b2> | <b3> | <b4> | <b5> ", height=2];
  node[ width=2 ];

  entry_1 [label="{<e>st_table_entry|<next>next}"];
  entry_2 [label="{<e>st_table_entry|<next>null}"];
  entry_3 [label="{<e>st_table_entry|<next>null}"];

  st_table:bins -> num_bins:b1;
  num_bins:b1 -> entry_1:e;
  entry_1:next -> entry_2:e;
  num_bins:b3 -> entry_3:e;
}
注:LR 指定了左右排序方式。
可以看到,节点的 label 属性支持类似于 HTML 语言中的 TABLE 形式的定义,通过行列的数目来定义节点的形状,从而使得节点的组成更加灵活。
软件模块组成图
digraph idp_modules{

  rankdir = TB;
  fontname = "Microsoft YaHei";
  fontsize = 12;

  node [ fontname = "Microsoft YaHei", fontsize = 12, shape = "record" ];
  edge [ fontname = "Microsoft YaHei", fontsize = 12 ];

      subgraph cluster_sl{
          label="IDP 支持层";
          bgcolor="mintcream";
          node [shape="Mrecord", color="skyblue", style="filled"];
          network_mgr [label="网络管理器"];
          log_mgr [label="日志管理器"];
          module_mgr [label="模块管理器"];
          conf_mgr [label="配置管理器"];
          db_mgr [label="数据库管理器"];
      };

      subgraph cluster_md{
          label="可插拔模块集";
          bgcolor="lightcyan";
          node [color="chartreuse2", style="filled"];
          mod_dev [label="开发支持模块"];
          mod_dm [label="数据建模模块"];
          mod_dp [label="部署发布模块"];
      };

  mod_dp -> mod_dev [label="依赖..."];
  mod_dp -> mod_dm [label="依赖..."];
  mod_dp -> module_mgr [label="安装...", color="yellowgreen", arrowhead="none"];
  mod_dev -> mod_dm [label="依赖..."];
  mod_dev -> module_mgr [label="安装...", color="yellowgreen", arrowhead="none"];
  mod_dm -> module_mgr [label="安装...", color="yellowgreen", arrowhead="none"];
}
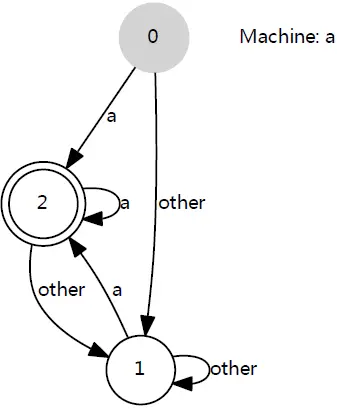
状态图
digraph automata_0 {
  size = "8.5, 11";
  fontname = "Microsoft YaHei";
  fontsize = 10;

  node [shape = circle, fontname = "Microsoft YaHei", fontsize = 10];
  edge [fontname = "Microsoft YaHei", fontsize = 10];

  0 [ style = filled, color=lightgrey ];
  2 [ shape = doublecircle ];

  0 -> 2 [ label = "a " ];
  0 -> 1 [ label = "other " ];
  1 -> 2 [ label = "a " ];
  1 -> 1 [ label = "other " ];
  2 -> 2 [ label = "a " ];
  2 -> 1 [ label = "other " ];

  "Machine: a" [ shape = plaintext ];
}
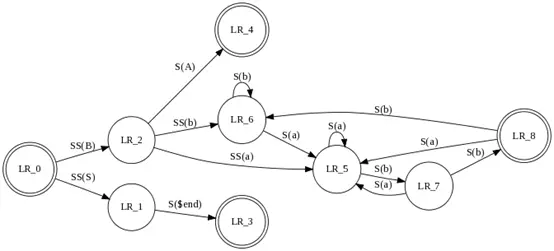
digraph finite_state_machine {
  rankdir = LR;
  size = "8,5"

  node [shape = doublecircle];

  LR_0 LR_3 LR_4 LR_8;

  node [shape = circle];

  LR_0 -> LR_2 [ label = "SS(B)" ];
  LR_0 -> LR_1 [ label = "SS(S)" ];
  LR_1 -> LR_3 [ label = "S($end)" ];
  LR_2 -> LR_6 [ label = "SS(b)" ];
  LR_2 -> LR_5 [ label = "SS(a)" ];
  LR_2 -> LR_4 [ label = "S(A)" ];
  LR_5 -> LR_7 [ label = "S(b)" ];
  LR_5 -> LR_5 [ label = "S(a)" ];
  LR_6 -> LR_6 [ label = "S(b)" ];
  LR_6 -> LR_5 [ label = "S(a)" ];
  LR_7 -> LR_8 [ label = "S(b)" ];
  LR_7 -> LR_5 [ label = "S(a)" ];
  LR_8 -> LR_6 [ label = "S(b)" ];
  LR_8 -> LR_5 [ label = "S(a)" ];
}
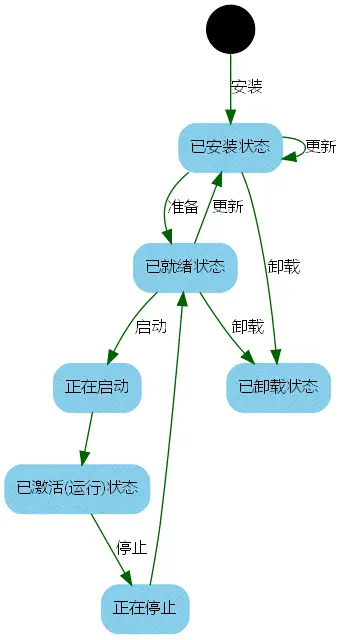
模块的生命周期图
digraph module_lc{
  rankdir=TB;
  fontname = "Microsoft YaHei";
  fontsize = 12;

  node [fontname = "Microsoft YaHei", fontsize = 12, shape = "Mrecord", color="skyblue", style="filled"];
  edge [fontname = "Microsoft YaHei", fontsize = 12, color="darkgreen" ];

  installed [label="已安装状态"];
  resolved [label="已就绪状态"];
  uninstalled [label="已卸载状态"];
  starting [label="正在启动"];
  active [label="已激活(运行) 状态"];
  stopping [label="正在停止"];
  start [label="", shape="circle", width=0.5, fixedsize=true, style="filled", color="black"];

  start -> installed [label="安装"];
  installed -> uninstalled [label="卸载"];
  installed -> resolved [label="准备"];
  installed -> installed [label="更新"];
  resolved -> installed [label="更新"];
  resolved -> uninstalled [label="卸载"];
  resolved -> starting [label="启动"];
  starting -> active [label=""];
  active -> stopping [label="停止"];
  stopping -> resolved [label=""];
}
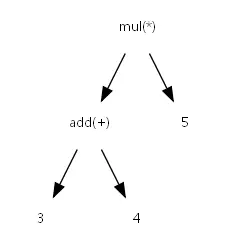
简单的抽象语法树
digraph ast{
  fontname = "Microsoft YaHei";
  fontsize = 10;

  node [shape = circle, fontname = "Microsoft YaHei", fontsize = 10];
  edge [fontname = "Microsoft YaHei", fontsize = 10];
  node [shape="plaintext"];

  mul [label="mul(*)"];
  add [label="add(+)"];

  add -> 3
  add -> 4;
  mul -> add;
  mul -> 5;
}
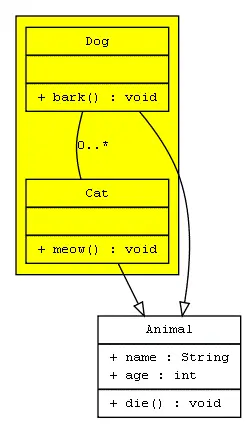
简单的 UML 类图
digraph G{

  fontname = "Courier New"
  fontsize = 10

  node [ fontname = "Courier New", fontsize = 10, shape = "record" ];
  edge [ fontname = "Courier New", fontsize = 10 ];

  Animal [ label = "{Animal |+ name : String\\l+ age : int\\l|+ die() : void\\l}" ];

      subgraph clusterAnimalImpl{
          bgcolor="yellow"
          Dog [ label = "{Dog||+ bark() : void\\l}" ];
          Cat [ label = "{Cat||+ meow() : void\\l}" ];
      };

  edge [ arrowhead = "empty" ];

  Dog->Animal;
  Cat->Animal;
  Dog->Cat [arrowhead="none", label="0..*"];
}
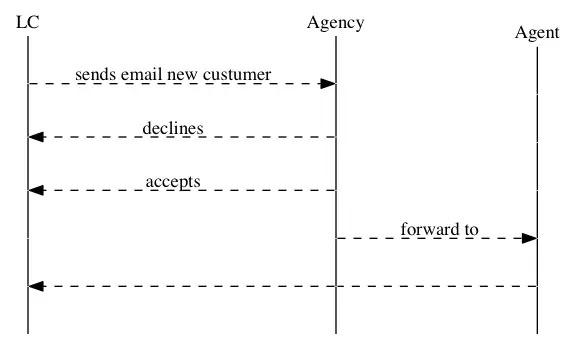
时序图
digraph G {
    rankdir="LR";
    node[shape="point", width=0, height=0];
    edge[arrowhead="none", style="dashed"]

    {
        rank="same";
        edge[style="solided"];
        LC[shape="plaintext"];
        LC -> step00 -> step01 -> step02 -> step03 -> step04 -> step05;
    }

    {
        rank="same";
        edge[style="solided"];
        Agency[shape="plaintext"];
        Agency -> step10 -> step11 -> step12 -> step13 -> step14 -> step15;
    }

    {
        rank="same";
        edge[style="solided"];
        Agent[shape="plaintext"];
        Agent -> step20 -> step21 -> step22 -> step23 -> step24 -> step25;
    }

    step00 -> step10 [label="sends email new custumer", arrowhead="normal"];
    step11 -> step01 [label="declines", arrowhead="normal"];
    step12 -> step02 [label="accepts", arrowhead="normal"];
    step13 -> step23 [label="forward to", arrowhead="normal"];
    step24 -> step14;
    step14 -> step04 [arrowhead="normal"];
}
rankdir=”LR”表示,布局从左 L 到右 R。可以看到,在代码中有{}括起来的部分。
{
    rank="same";
    edge[style="solided"];
    Agency[shape="plaintext"];
    Agency -> step10 -> step11 -> step12 -> step13 -> step14 -> step15;
}
每一个 rank=”same”的 block 中的所有节点都会在同一条线上。我们设置了所有的线为虚线,但是在该 block 中,将线改为 solided。
如果你追求高效的开发速度,并希望快速的将自己的想法画出来,那么 graphviz 是一个很不错的选择。graphviz 的强项在于自动布局,当图中的顶点和边的数目变得很多的时候,才能很好的体会这一特性的好处。
最后,提供 Graphviz 下载地址 。
评论列表 (0条):
加载更多评论 Loading...